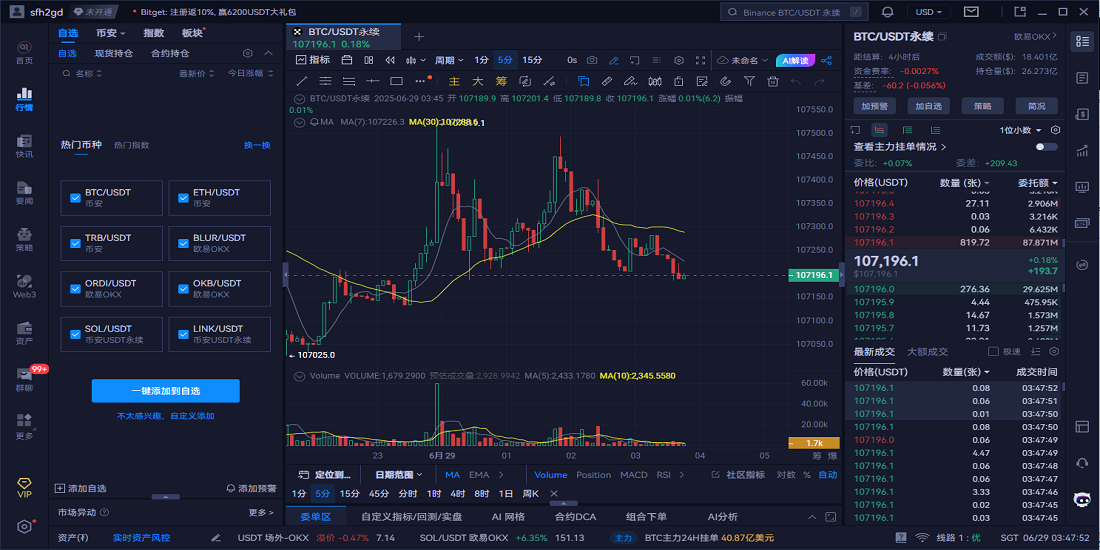
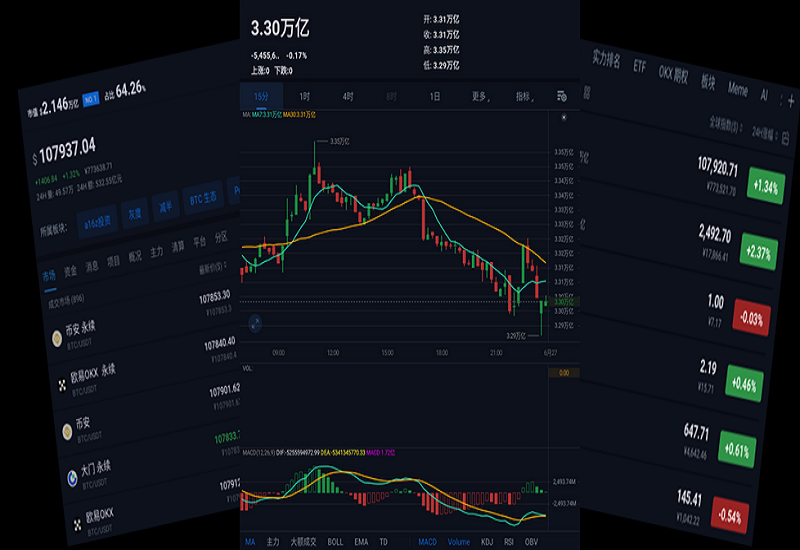
AiCoin Crypto Market Data, K-Line Charts and On-Chain Data
Track Bitcoin, Ethereum and other crypto assets with multi-exchange prices, K-line charts, derivatives data, large-order activity, on-chain data, alerts and market news.
Multi-Exchange Crypto Data, K-Line Charts and Market Alerts
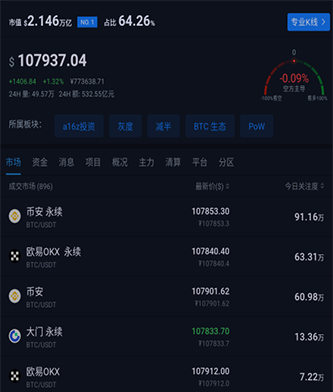



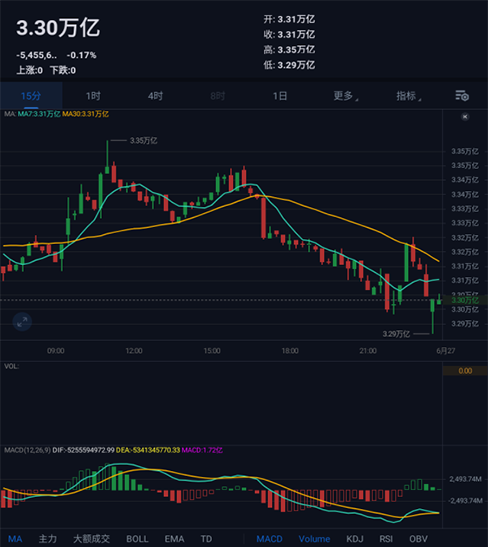
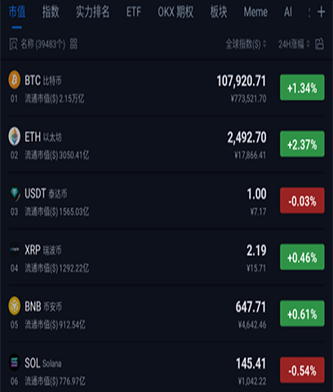
Prices, charts, derivatives and on-chain data


Multi-Exchange Market Data
Compare spot and derivatives prices, trading pairs, volume, order-book depth and exchange-level market data across supported markets.

K-Line Charts and Technical Indicators
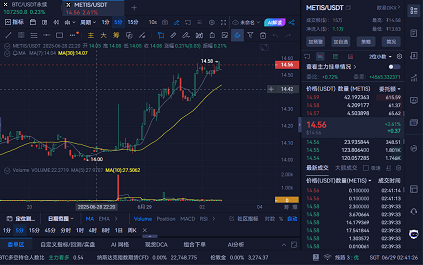
Use multi-timeframe K-line charts, drawing tools, technical indicators and saved layouts to review price, volume and market structure.

On-Chain Activity and Market Alerts
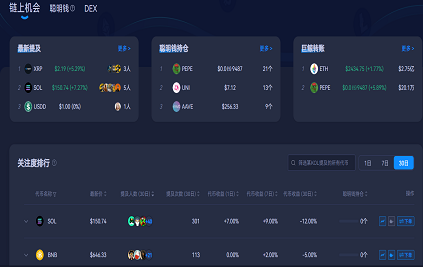
Review large transfers, whale activity, funding data, market events and selected on-chain changes alongside price and exchange data.
 Bitcoin
 Ethereum
 Tether
 Ripple
 Binance Coin
 Solana
 USD Coin
 TRON
TRON Dogecoin
 Cardano
 Wrapped Bitcoin
 Bitcoin Cash
 ChainLink
 Avalanche
 Shiba Inu
 Litecoin
 Monero
 Aave
Aave Pi Network
 Pepe
Pepe Aptos
Aptos Ethereum Classic
 Cronos
Crypto Market Data and Analysis Tools in AiCoin
- Crypto Prices and Market Data
- K-Line Charts and Indicators
- Price, Volume and Condition Alerts
- On-Chain and Whale Activity
- Exchange Markets and Watchlists
- Market News and Data Context

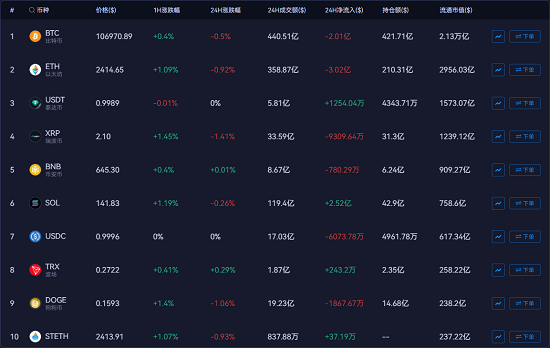
Compare Crypto Markets Across Exchanges
- Bitcoin
- Ethereum
- Tether
- Ripple
- Binance Coin
- Solana
- USD Coin
- TRON
- Dogecoin
- Cardano
- Wrapped Bitcoin
- Bitcoin Cash Bitcoin Cash
- ChainLink
- Avalanche
- Shiba Inu
- Litecoin
- Monero
- Aave
- Pi Network
- Pepe
- Aptos
- Ethereum Classic
- Cronos


Review Derivatives, Large Orders and On-Chain Activity
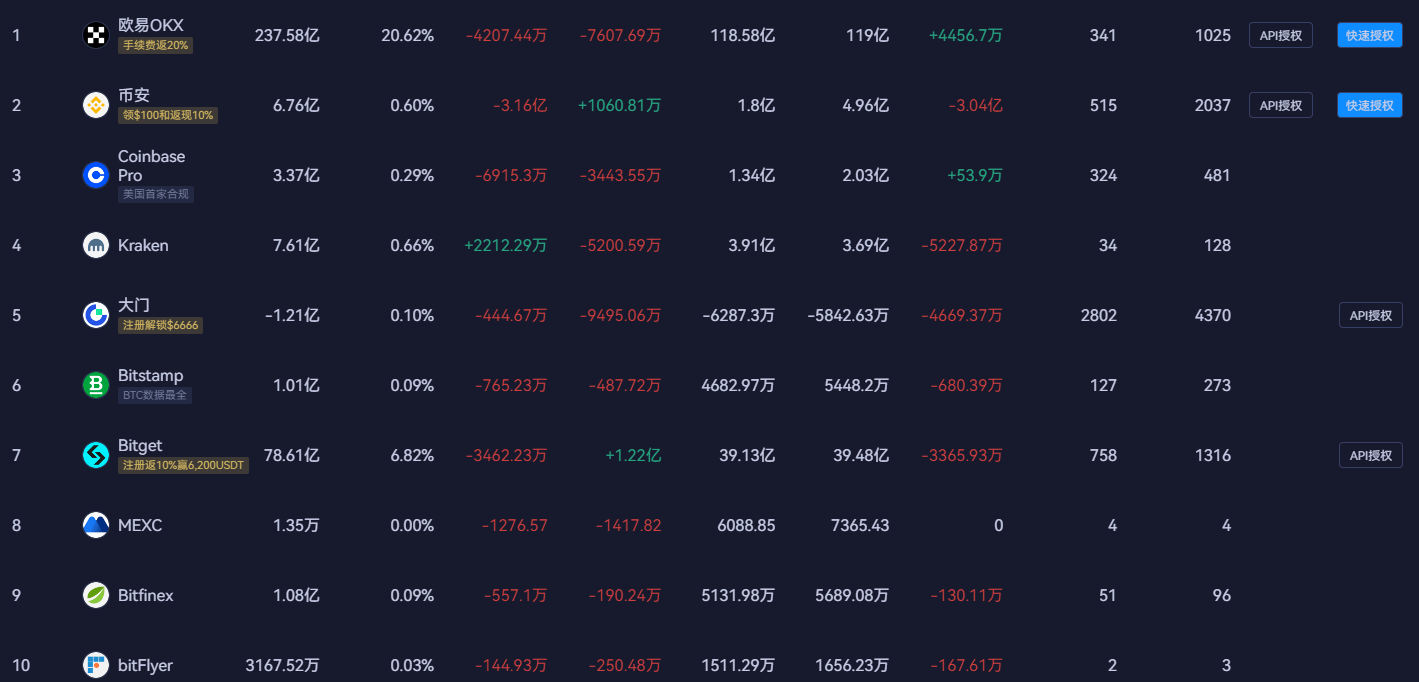


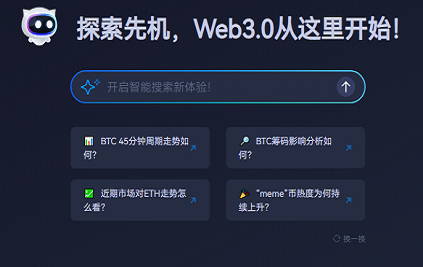
Track Price Changes, Large Orders and Alerts

Ways to Review AiCoin Market Data
 Multi-Exchange Market ComparisonSpot and derivatives markets
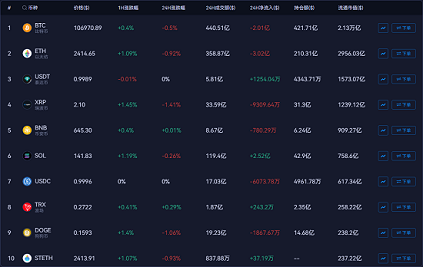
Compare prices, trading volume, order-book depth, and trading pairs across supported exchanges to review how the same asset behaves in different markets.
 K-Line Charts and Technical IndicatorsTechnical analysis and trend research
Use multi-timeframe K-line charts, drawing tools and technical indicators to compare price, volume and trend changes across selected assets.
 Multi-Window Market Data ViewDesktop chart layouts
View multiple charts, watchlists and markets at the same time to compare assets and timeframes from one desktop layout.
 Derivatives and Funding Rate AnalysisFutures market data
Review perpetual contracts, funding rates, spot-futures spreads, and related metrics to observe leverage conditions and changes in market positioning.
 Price and Market Condition AlertsMarket volatility monitoring
Set alerts for price levels, percentage changes, volume or indicator conditions to monitor selected market changes.
 Basic Market Data ReviewPrices, market cap and rankings
Review prices, market capitalization, percentage change, exchange markets and charts before comparing derivatives or on-chain data.
 Account and API ConnectionsConnected account and data access
Connect supported accounts or API access points where available, with access determined by the permissions granted to each connection.
 Desktop Charting and Market ReviewLong-session market analysis
Save chart layouts, switch indicators, and keep markets visible in Windows or macOS clients for desktop research, monitoring, and review.
 Mobile Watchlists and AlertsFollow markets away from desktop
Use mobile access to review watchlists, price changes, and selected alerts when you are away from your primary desktop workspace.
 Crypto News and Market EventsNews context and event tracking
Combine market news, project updates, rankings, and community discussion with live prices to understand the events behind market movement.
 Drawing Tools and Custom IndicatorsPersonalized technical analysis
Save trend lines, support and resistance levels, chart notes, and indicator settings to create reusable analysis layouts.
 Historical Signals and Indicator ReviewIndicator research and review
Compare historical K-line data, indicator conditions and signal behavior to review how market patterns changed across different periods.
 Historical Chart ReviewMulti-timeframe market analysis
Review price, volume, and indicator changes across different periods to compare trends, ranges, breakouts, and shifts in market structure.
 Cross-Platform Market AccessWeb and app continuity
Access market data through web, Windows, macOS, Android, iOS, and iPad entry points so watchlists and research fit different devices.
 Price and Percentage Change AlertsWatchlist monitoring
Create price, percentage-change, and volatility conditions for selected assets to follow Bitcoin, Ethereum, and active market sectors.
 Market Cap, Volume and Asset RankingsTrending market discovery
Use market-cap, gainers, losers, volume and themed rankings to compare cryptocurrencies and market sectors.
 Charts, Indicators and AlertsMarket chart configuration
Use charts, drawing tools, technical indicators and alerts together when comparing current and historical market data.
 Market Data, News and AlertsMarket information in one interface
View prices, K-line charts, derivatives data, on-chain activity, market news and alerts from the same product interface.
 Historical Data and Indicator ReviewHistorical chart comparison
Compare historical charts, indicator conditions and market data across different periods to review how price and market structure changed.
 News and Community InformationNews alongside market data
Read market news, flashes and community content alongside price, volume and on-chain data.
AiCoin Market Data and K-Line Chart FAQ
AiCoin is a crypto market data and analysis platform that combines real-time prices, multi-exchange data, K-line charts, derivatives metrics, large-order activity, on-chain data, alerts and market news.
AiCoin covers Bitcoin, Ethereum, stablecoins, altcoins, spot markets, perpetual and futures data, market-cap rankings, trading volume, order books, funding rates, and exchange-level price movement.
AiCoin provides multi-timeframe K-line and candlestick charts, drawing tools, technical indicators, saved layouts, multi-window monitoring, and custom indicator workflows for structured market analysis.
Users can configure alerts for price levels, percentage moves, volume changes, indicator conditions, large trades, market events, and selected on-chain activity to follow important market signals.
The web version supports browser-based market research, while Windows and macOS clients suit multi-window desktop analysis. Android, iOS, and iPad access help users follow watchlists and alerts away from the desktop.
Download AiCoin for Desktop and Mobile Market Analysis


AiCoin Market Analysis Across Web, Desktop and Mobile